What Are FAA Sectional Charts?
Think of the sectional chart as a pilot’s map, graphically representing a region’s airspace. Consider them as flat depictions of 3 dimensional geography and airspace.
Intro to Sectional Charts:
Sectional charts provide information about airspace, terrain, and obstacles to help pilots navigate safely. This information is critical for planning your sUAS flight missions.
These charts display various key elements, such as:
- Airspace boundaries: Different classes of controlled and uncontrolled airspace, including Class B, C, D, and E, are shown with clear markings.
- Terrain and elevations: Altitude information for different areas, showing both Mean Sea Level (MSL) and Above Ground Level (AGL) heights, helping pilots avoid obstacles.
- Obstacles: Towers, buildings, and other structures that could pose a risk to flight, along with their heights.
- Airports and runways: Locations and information about airports, including available services, runway lengths, and traffic patterns.
- Special use airspace: Areas such as military operations zones (MOAs), restricted areas, and warning zones.
- Natural features: Rivers, lakes, mountains, and other landforms that affect flight routes.
- Man-made features: Highways, railways, and cities are also marked to assist in visual navigation.
Updating Sectional Charts
Sectional charts are updated and republished every 56 days.
These updates include latest information on airspace classifications, navigation aids, airports, and other critical details.
An example of something that might change on a sectional chart between publications is the airspace classification around a newly constructed airport or expanding city. For instance, if an airport gains more traffic, it could shift from uncontrolled Class G airspace to controlled Class D airspace, requiring different operational procedures for pilots.
How Are Sectional Charts Organized?
Sectional charts are broken into distinct parts, each representing a particular geographic zone.
About Sectional Chart Zones:
These zones are often named after big cities or notable landmarks, such as Denver, Los Angeles, or Houston.
In the visual aids below you’ll see in:
- Figure 1: How the FAA has split up the United States sectional chart regions.
- Figure 2: Sectional Chart for Denver Region.
Sectional Chart Elements
In this section, we’ll give you a glimpse into some of the key areas shown on FAA sectional charts.
Updates to Sectional Charts
An example of something that might change on a sectional chart between publications is the airspace classification around a newly constructed airport or expanding city. For instance, if an airport gains more traffic, it could shift from uncontrolled Class G airspace to controlled Class D airspace, requiring different operational procedures for pilots.
Introduction to
Chart Supplement
The Chart Supplement, formerly known as the Airport/Facility Directory (A/FD), provides detailed and comprehensive information for flight operations, complementing what you find on sectional charts
Purpose & Layout of Chart Supplement:
Purpose: The Chart Supplement, formerly known as the Airport/Facility Directory (A/FD), provides detailed and comprehensive information for flight operations, complementing what you find on sectional charts. Here’s what it covers:
Layout: The Chart Supplement U.S. divides the country into seven regions for easier reference and organization. Each region covers a specific area and contains detailed information on airports, navigation facilities, and other pertinent aviation data relevant to that area. The regions are:
- North Atlantic
- North Central
- South Central
- South East
- South West
- West
- North West
Contents of Chart Supplement
Chart Supplement compliments Sectional Charts:
While sectional charts give you a broad overview of geographical and operational aspects of airspace, the Chart Supplement dives into specifics, offering in-depth information necessary for safe and efficient flight planning and operations.
Airport Information: Detailed descriptions of airport facilities, services, and runways. While sectional charts provide a basic overview of airports, the Chart Supplement offers in-depth details.
Runway Data: Specifics such as length, surface type, and lighting. Sectional charts show runway layout, but the Chart Supplement gives exact measurements and conditions.
Communication Frequencies: Frequencies for radio communications such as Air Traffic Control (ATC) and Flight Service Station (FSS). While sectional charts mark where these frequencies are used and provide frequency information in the legend, the Chart Supplement lists ALL relevant contact information.
Special Use Airspace Contact Information: Sectional charts include graphical markers for restricted areas, prohibited areas, and MOAs. The Chart Supplement offers contact information, detailed descriptions, regulations, and usage information for these areas.
Airport Services: Availability of fuel, maintenance, and other services. This is generally detailed in the Chart Supplement, while sectional charts might only show basic airport symbols.
Weather Related Procedures: Observations and reporting procedures at specific airports. Sectional charts provide basic weather symbols, but the Chart Supplement includes more detailed weather-related procedures.
Flight Procedures: Arrival and departure procedures.
Emergency Information: Details on emergency services and contacts, which are more comprehensively outlined in the Chart Supplement compared to the sectional charts.
Airport Layout Diagrams: Diagrams showing the layout of the airport including runways, taxiways, and terminals. Sectional charts depict the general layout, but the Chart Supplement provides precise diagrams.
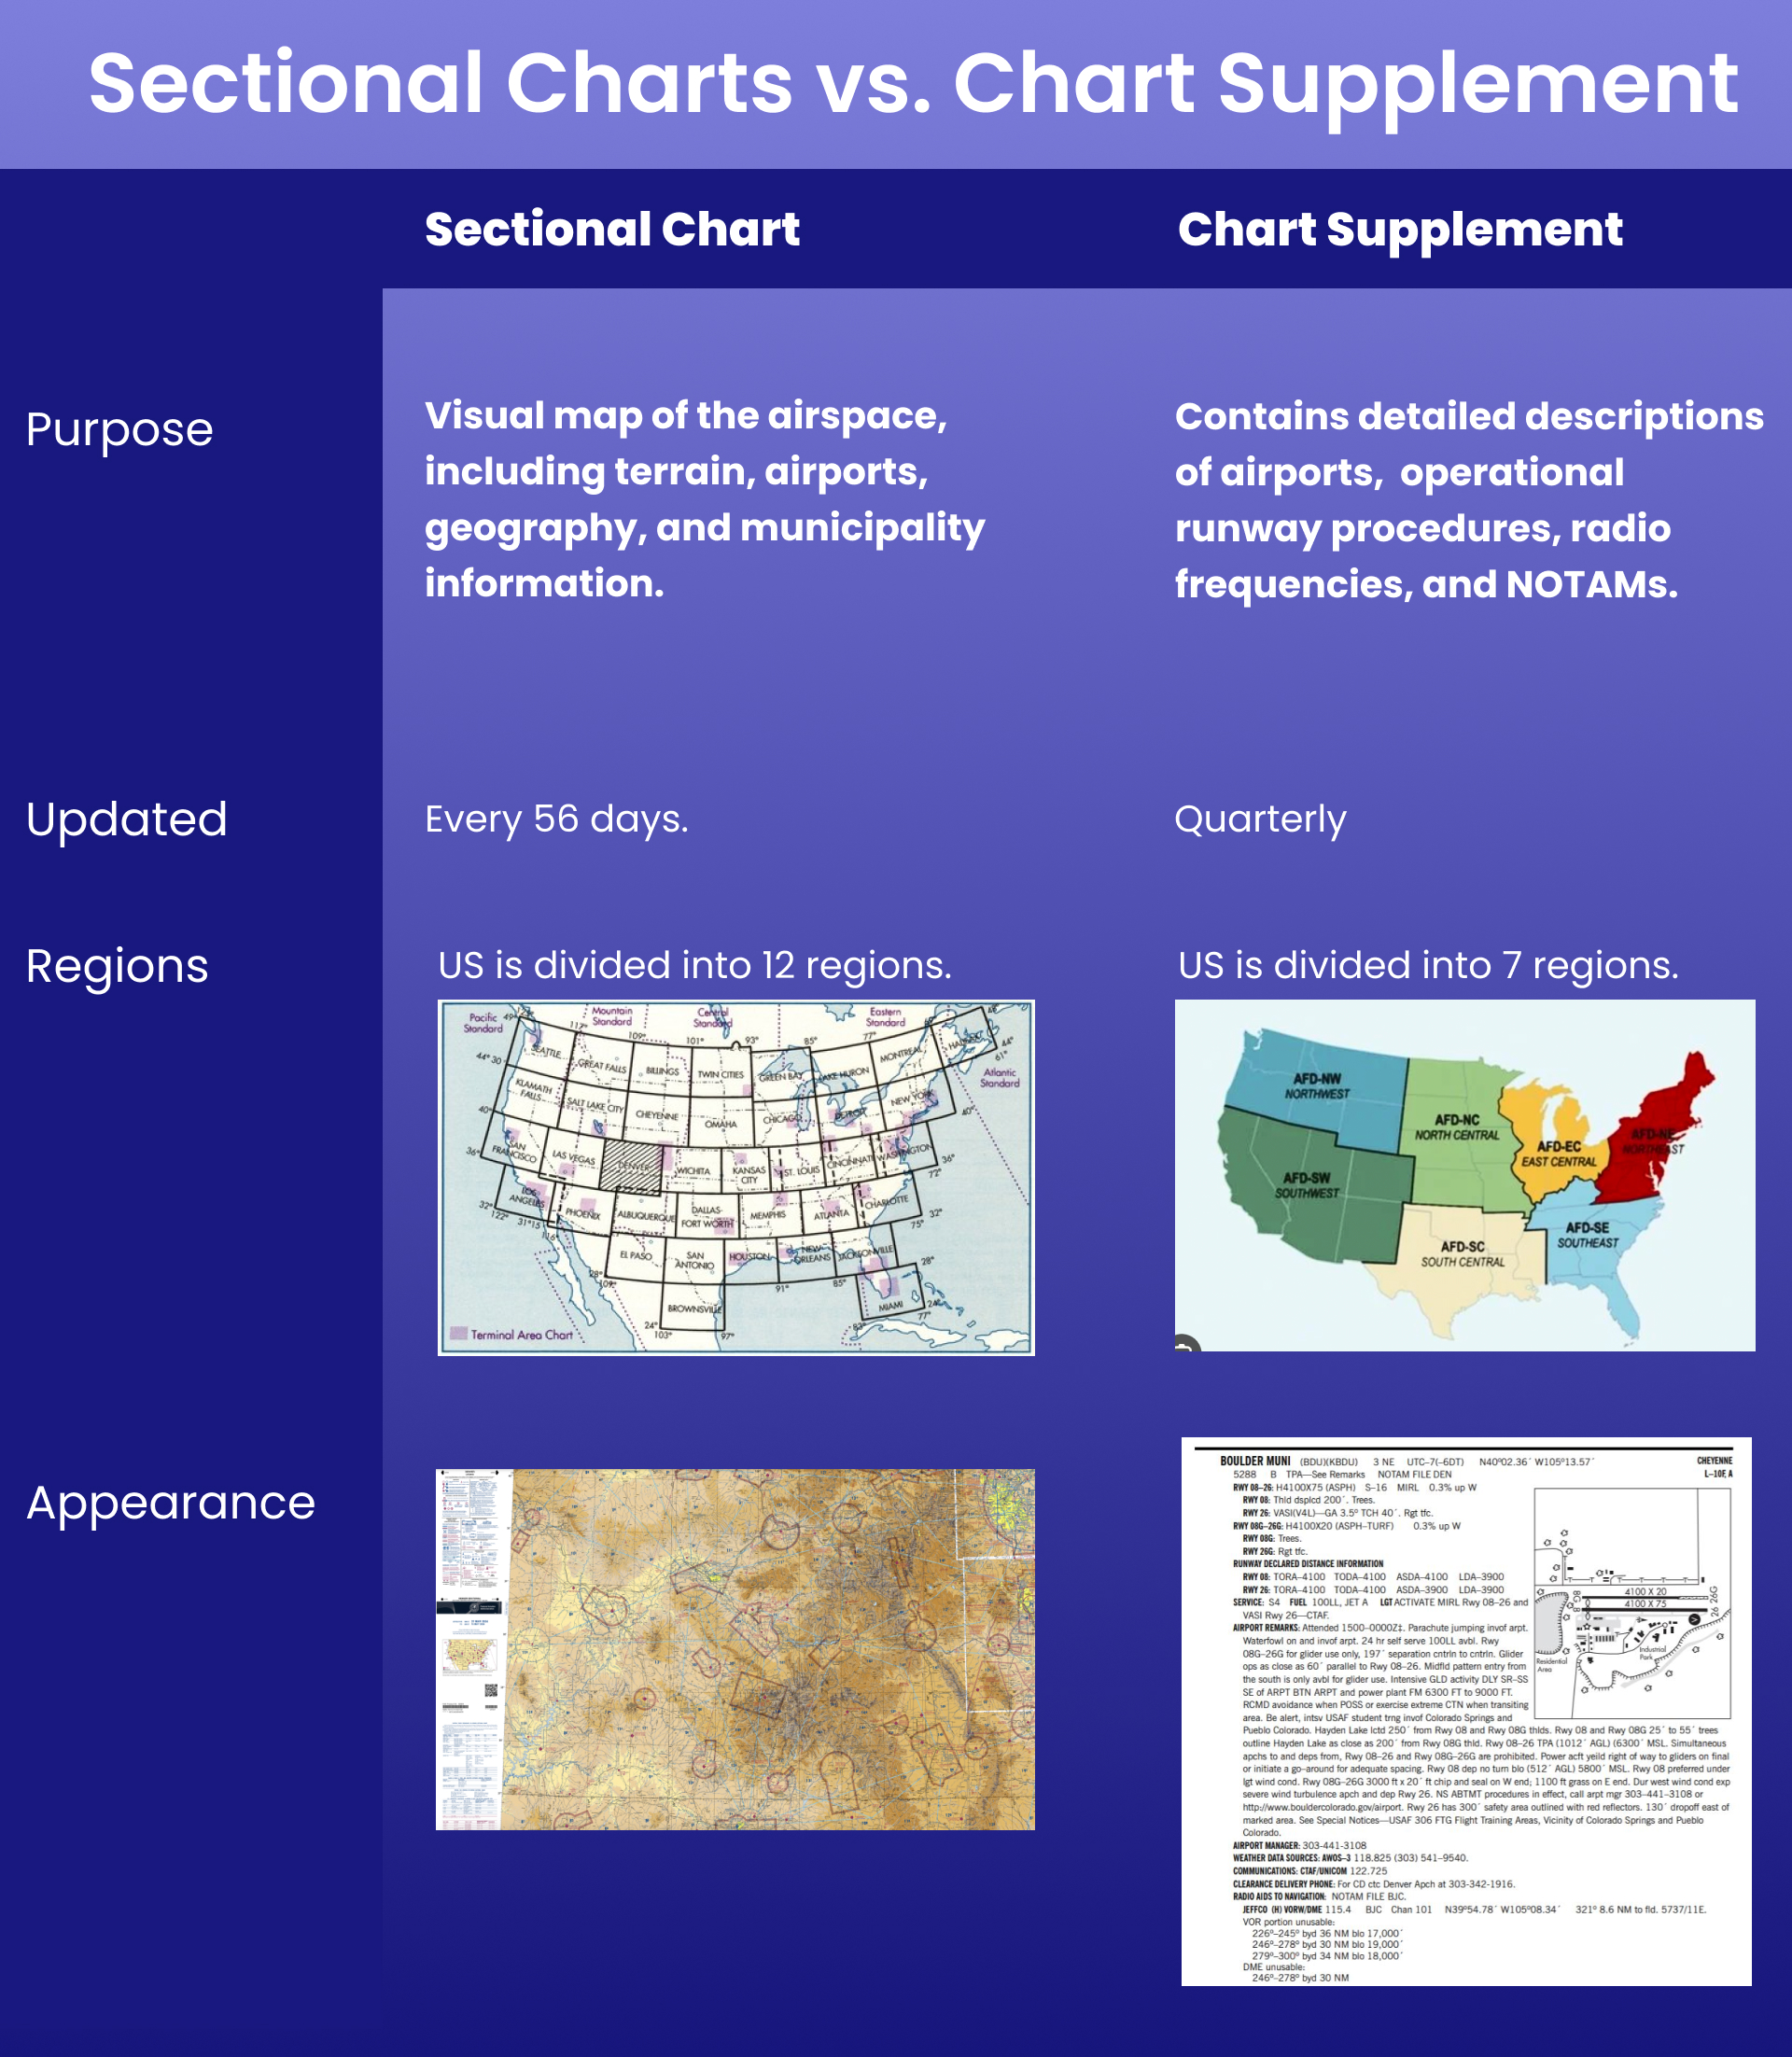
Infographic Study Aid
This infographic will help you distinguish between these two crucial tools, illustrating their unique roles in flight planning and how they work together to ensure safe and informed navigation.


